Canobie Lake Park TV Commercials
Score Card
Data available through 02/07/2026Total Creatives
2
National Airings
Spend Rank
Airing Rank
National TV Spend
Impressions
Linear SOV
Streaming SOV
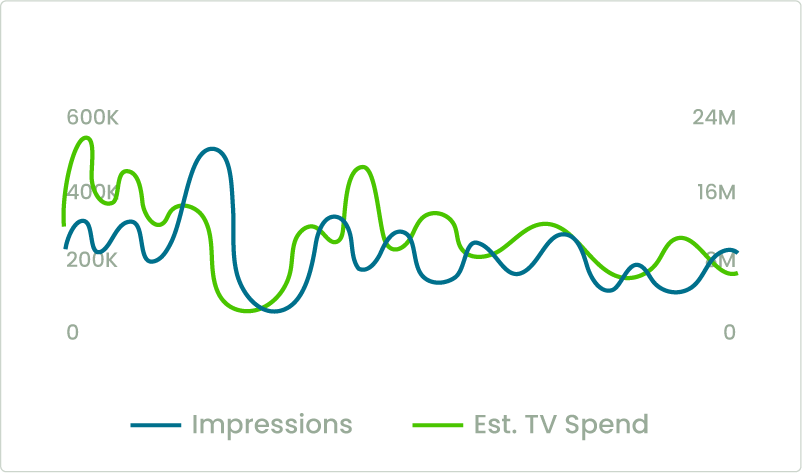
Daily Impressions & Spend Activity
Top Streaming Publishers
This is a profile preview from the iSpot platform
About
Request a demo to track TV ad campaigns for Canobie Lake Park. Competing brands in the Travel: Resorts & Theme Parks industry include Disney World, Six Flags, Universal Orlando Resort, Atlantis, and Disneyland. You can connect with Canobie Lake Park on Facebook, Twitter and YouTube.
Canobie Lake Park Creative Assessment
Get a DemoAd effectiveness starts with the creative, which is why iSpot's Creative Assessment solutions provide fast, actionable insights into the effectiveness and emotional impact of video ads. Brands can objectively measure and benchmark ad performance against competitive and customizable norms while gaining deeper insights through viewer verbatim comments that explain the "why" behind the scores. Using iSpot's Creative Assessment in both pre-market and in-market stages, brands can evaluate creative strengths and weaknesses, make data-driven adjustments, and ultimately improve ad effectiveness while reducing time and spend on creative development.
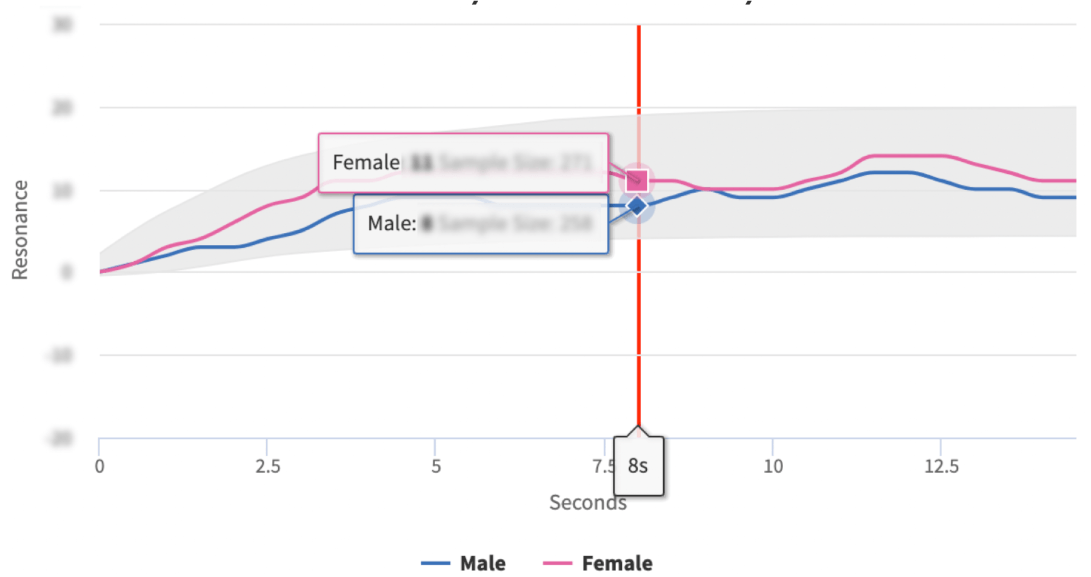
Second-by-Second Analysis
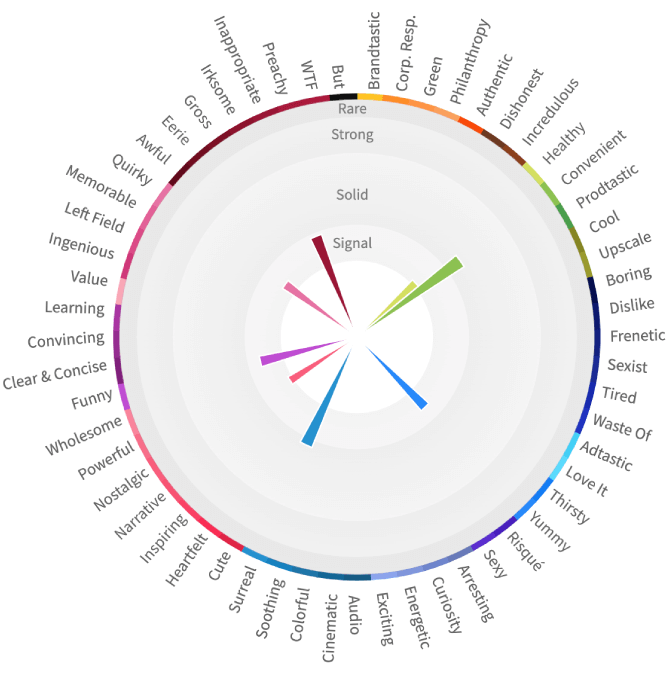
Emos
Representative Verbatims
Viewer's Voice
Canobie Lake Park Audience Measurement
Get a DemoiSpot empowers advertisers with real-time, second-by-second visibility into every ad across screens, helping optimize media strategies and cut excess frequency and waste. With a robust catalog of over 2.5 million creatives and data from 83 million smart TVs, plus integrations with 400+ streaming platforms and DSPs, iSpot delivers fast, accurate and actionable analytics on both campaign performance and competitor strategies. By measuring impressions, airings, and attention across all viewing environments, advertisers can eliminate blind spots and gain a competitive edge through reliable benchmarking against brands like Disney World, Six Flags, Universal Orlando Resort, Atlantis, and Disneyland.
Media Measurement
Spend SOV
Household Impressions
Local Impressions
OOH Impressions
P18+ Impressions
Streaming Impressions
Streaming SOV
Streaming Benchmark
Unified Measurement
Streaming Impressions Overlap with Linear
Streaming Reach
Streaming Reach Overlap
Streaming Average Frequency
Streaming Frequency Overlap with Linear
Attention Analytics
Attention Index
Interruption Rate
Canobie Lake Park Business Outcomes
Get a DemoiSpot enables advertisers to connect TV and streaming ad exposure directly to key business outcomes like in-store traffic, website visits, and purchases. By mapping campaign data to first- and third-party sources—such as location, intent, sales, and both online and offline conversions—advertisers can avoid wasting spend on ads that don't drive results. iSpot's real-time attribution technology makes it easy to optimize campaigns across platforms for maximum ROAS, ensuring every dollar works harder.
Conversion Events
Impressions
Conversion Rate
Cost Per Unit (CPU)
Lift
Exposed Rate
Unexposed Rate
Optimal Frequency
Canobie Lake Park TV Commercials
Travel TV Ad Resources
Have questions about this brand or our ad catalog? Check out our FAQ Page.
This is a profile preview from the iSpot platform
About
Request a demo to track TV ad campaigns for Canobie Lake Park. Competing brands in the Travel: Resorts & Theme Parks industry include Disney World, Six Flags, Universal Orlando Resort, Atlantis, and Disneyland. You can connect with Canobie Lake Park on Facebook, Twitter and YouTube.
